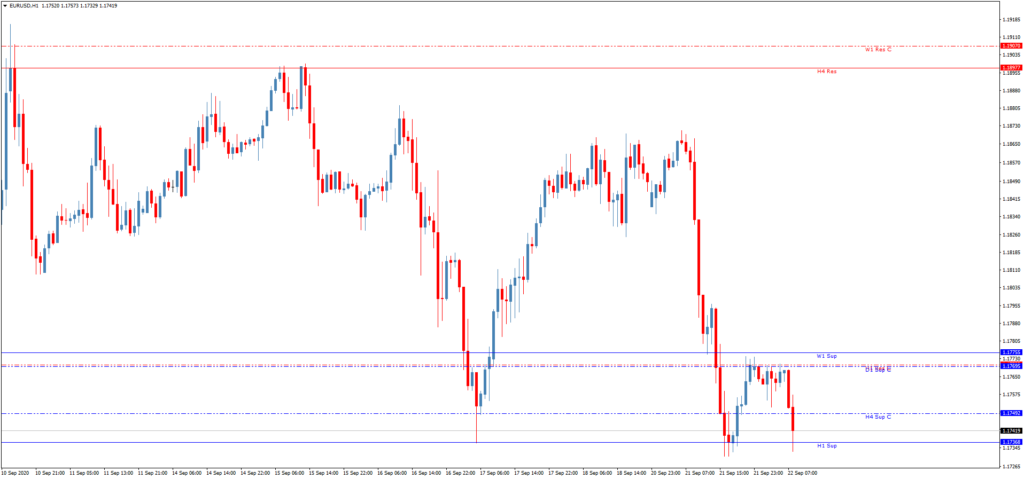
The ThreeLineBreak Chart S/R Levels Trading Indicator is an interpretation of Steve Nison’s Three Line Break strategy. It displays current and potential support and resistance levels on a price chart based on closing prices:
- Blue lines – support levels;
- Red lines – resistance levels;
- Dashed lines – potential levels.
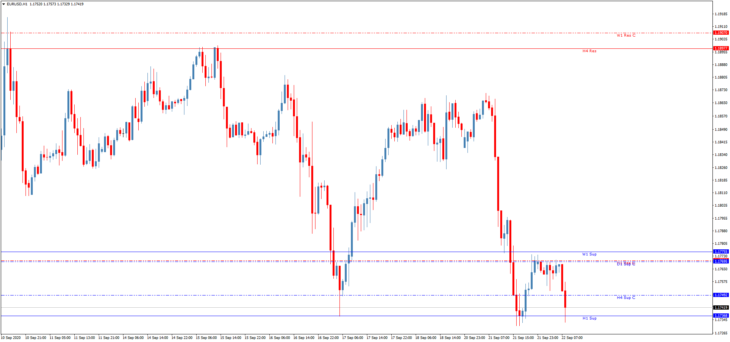
The LB parameter of the indicator sets the number of levels considered for breakthroughs. When a certain number of points are passed, the level lines are pulled up on the specified time frame.
Keep in mind that the ThreeLineBreak Chart S/R Levels Trading Indicator only shows levels from higher time frames on the chart.
- Download the ThreeLineBreak Chart S/R Levels Indicator
Other Profitable Technical Indicators
- Fractal Huly Graal Arrow Trading Indicator
- Arrow Indicator for Scalping CCI w HaosVisual MTF BDG+TT [FS]
- ADX of OBV TT Trading Indicator
FAQ
What is the ThreeLineBreak Chart S/R Levels Indicator?
The ThreeLineBreak Chart S/R Levels Indicator is a tool that identifies support and resistance levels on a price chart using Steve Nison’s Three Line Break strategy.
How does the ThreeLineBreak Chart S/R Levels Indicator work?
This indicator uses closing prices to display current and potential support and resistance levels, with blue lines for support, red lines for resistance, and dashed lines for potential levels.
Can the ThreeLineBreak Chart S/R Levels Indicator be used on any time frame?
The ThreeLineBreak Chart S/R Levels Indicator only shows levels from higher time frames on the chart, making it useful for identifying broader market trends.