Fibonacci Extensions
Fibonacci extensions plot horizontal lines based on Fibonacci ratios to identify key support and resistance levels beyond the initial trend swing.
Select the swing low and high on the chart, then drag the tool from low to high.
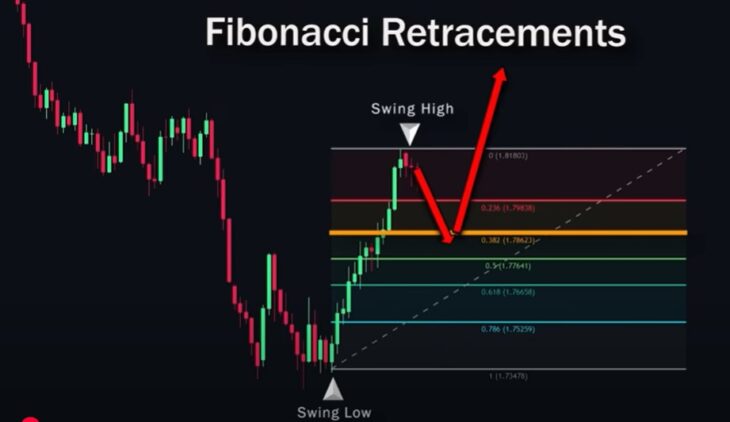
Wait for price to pull back to a level like 0.382, a common reversal point for entries. Combine with other signals for confirmation, as reversals can occur at various levels.
Breakout Patterns
Breakouts are sharp price moves after consolidation, like a sudden drop following sideways action.
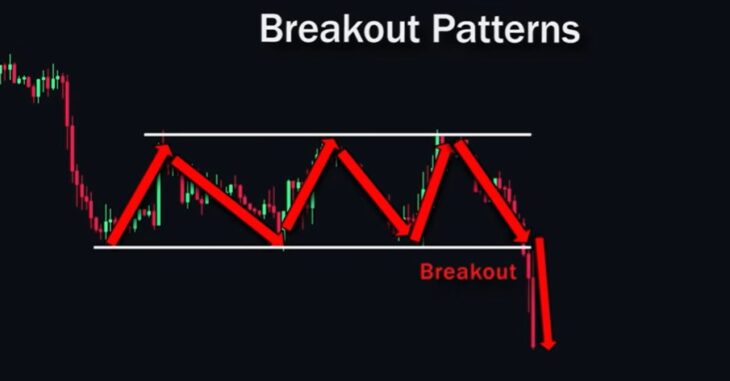
Spot them early using wedges, triangles, or rectangles to trade the impending directional surge.
Reversal Patterns
Reversal patterns signal a trend shift, forming counter-moves against the current direction.
Key examples:
- Double top and double bottom
- Triple top and triple bottom
- Head and shoulders
- Cup with handle
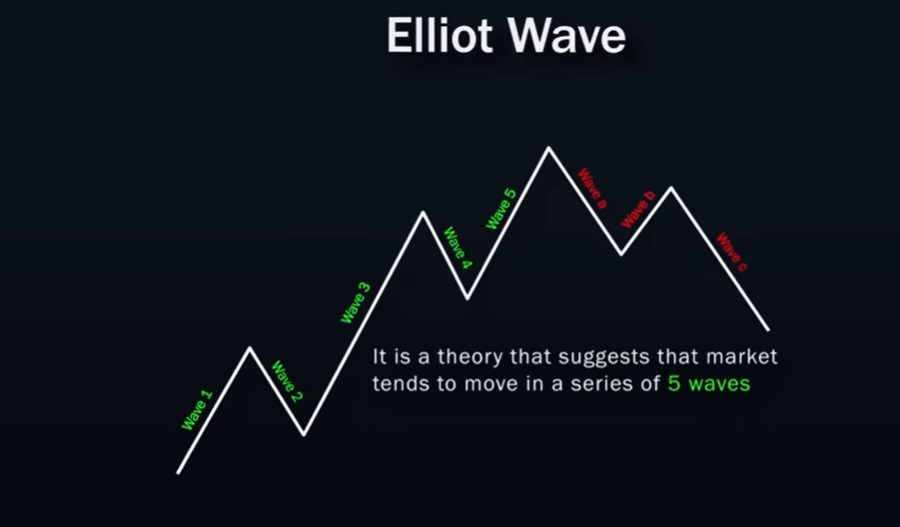
Elliott Waves
Elliott Wave theory identifies five impulse waves followed by three corrective waves (A, B, C), enabling predictions of price direction.
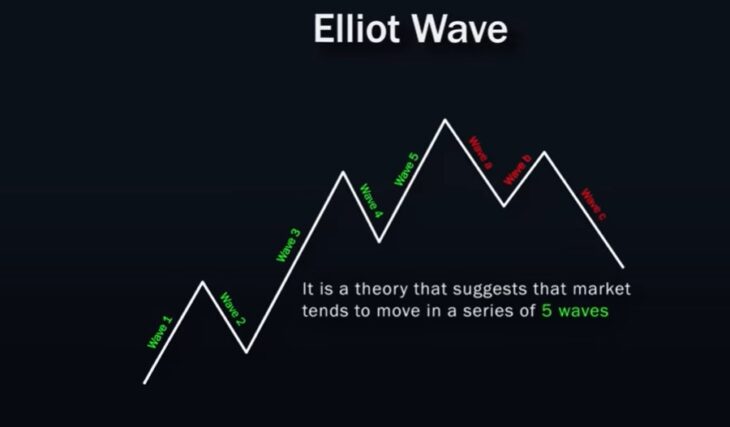
Valid waves follow rules:
- Wave 2 cannot exceed wave 1, often retracing to 0.618 Fibonacci.
- Wave 3 is longest among 1, 3, and 5.
- Wave 4 stays above wave 1 peak, typically retracing to 0.382 Fibonacci.
Example: Enter long if wave 4 hits 0.382 before resuming up.
Fair Value Gap
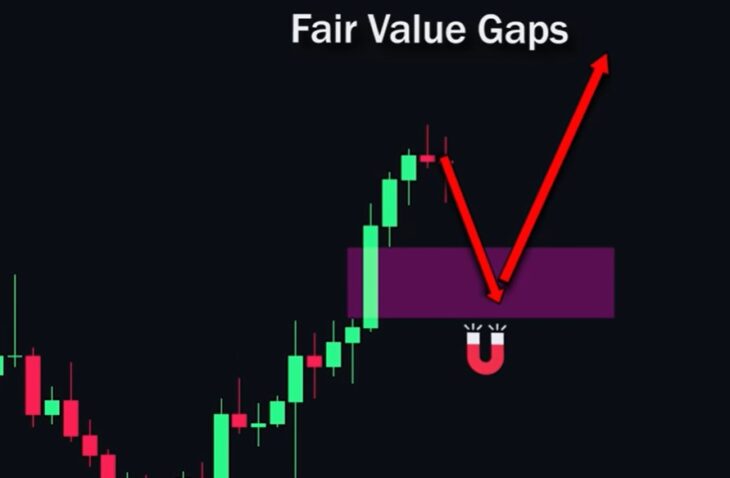
Fair Value Gaps form from imbalances, creating gaps between candles. Mark the gap with a rectangle; price often returns here as a magnet before continuing.
Candlestick Patterns
Candlestick shapes predict price action.
- Engulfing: Strong momentum in the engulfing candle’s direction.
- Hammer and shooting star: Rejection via long wicks.
- Doji: Indecision in the market.
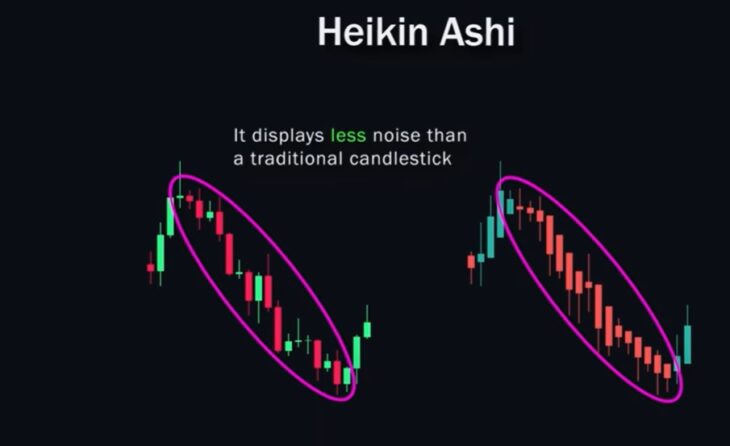
Heikin Ashi
Heikin Ashi smooths candles for trend clarity.
- Green candles signal uptrends.
- Red candles signal downtrends.
- Larger bodies indicate stronger trends.
Use for analysis only, not actual prices.
Lunar Phases
Lunar cycles may influence trader emotions and trends.
- New moon: Bullish bias.
- Full moon: Bearish bias.
Best as confirmation tool.
Renko Charts
Renko uses price-based bricks, ignoring time to filter noise.
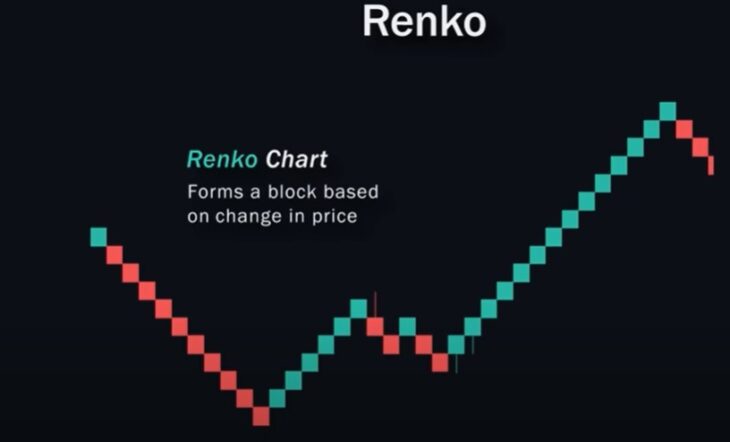
- Green bricks: Uptrend.
- Red bricks: Downtrend.
Harmonic Patterns
Fibonacci-based patterns forecast turns.
- Bat: M-shaped.
- Butterfly
- Crab
Support and Resistance
Horizontal levels from past bounces.
- Below price: Support for buys.
- Above price: Resistance for sells.
Dynamic Support and Resistance
Uses moving averages or indicators instead of static lines.
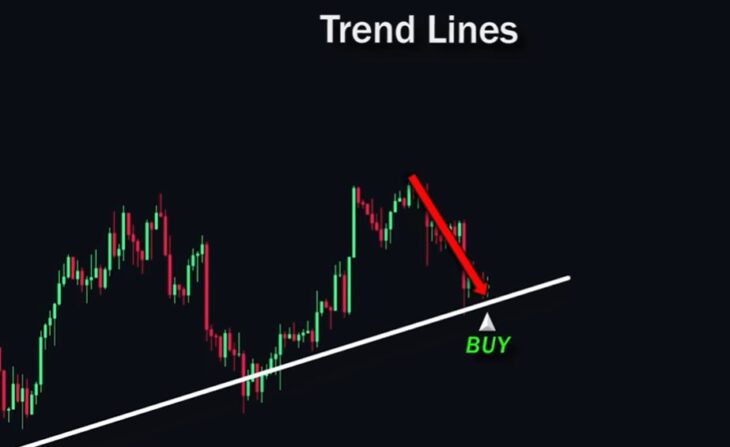
Trend Lines
Diagonal lines define direction.
- Upward: Bullish.
- Downward: Bearish.
Retests offer entry opportunities.
Gann Fan
Angular lines act as dynamic support/resistance.
Trend Indicators
- MACD: Line crossovers signal shifts.
- Moving averages: Price above = bullish; below = bearish.
- Parabolic SAR: Dots below = uptrend; above = downtrend.
Oscillators
Measure momentum in ranging markets.
- RSI: Oversold for buys, overbought for sells.
- Stochastic: Oversold/overbought zones plus line crossovers signal turns.
Divergences
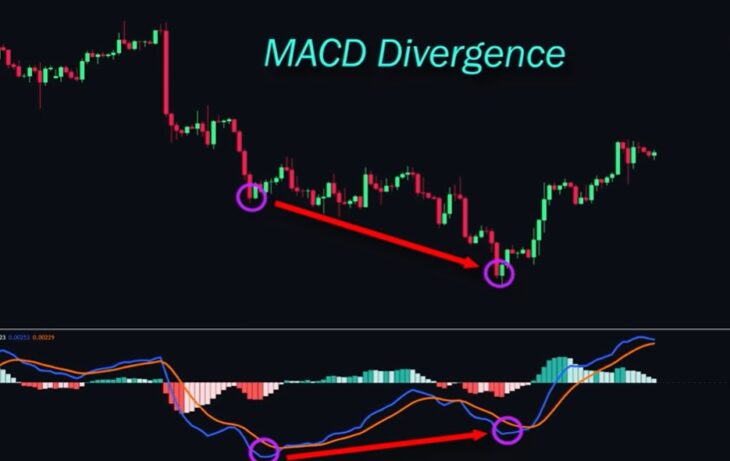
Price and indicator oppose, hinting reversals. Example: Price higher highs but MACD lower highs = bearish divergence.
Volume Indicators
- Price Volume: Bar length shows volume strength.
- VWAP: Volume-weighted average as dynamic S/R.
- Volume Profile: Horizontal volume reveals key levels.
Demand and Supply Zones (Order Blocks)
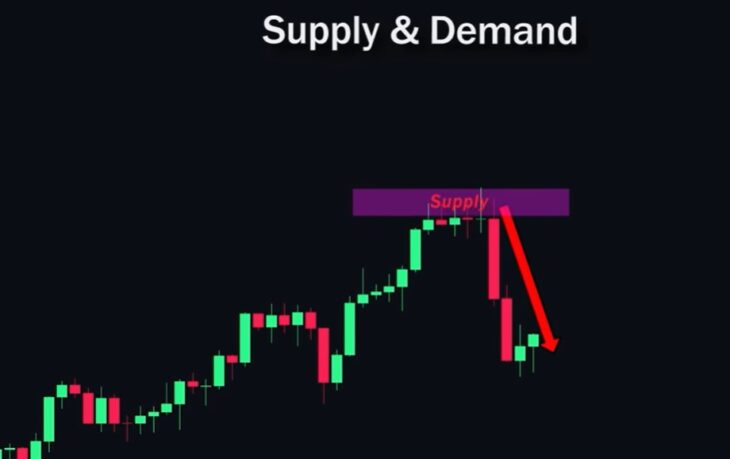
- Demand: Sharp rises signal buy zones.
- Supply: Sharp drops signal sell zones.
Market Structure
- Uptrend: Higher highs and lows.
- Downtrend: Lower highs and lows.
BOS: Breaks prior high/low in trend.
CHoCH: Breaks structure, signaling reversal.
FAQ
What is the best Fibonacci level for entries?
The 0.382 retracement level often signals reversals, but confirm with volume or other tools for reliability.
How do breakouts differ from reversals?
Breakouts continue after consolidation in the trend direction; reversals shift against the trend using patterns like head and shoulders.
Are lunar phases reliable for Forex trading?
They serve as sentiment confirmation but lack strong evidence; combine with technical indicators for decisions.