


There is a market theme that is currently prevalent in almost all advanced economies — a head and shoulders pattern, that if initiated could bring world indexes more than a few percent lower. There is a wedge formation seen in the German DAX, the French CAC40, the British FTSE 100, the Shanghai Composite, and the Nikkei 225 just to name a few. Also junk bonds (HYG) are exhibiting similar patterns. But the most important markets, with the most to lose are the S&P 500 and the Dow Jones Industrial Average. The wedge formation is begging for a break and with the head and shoulders pattern in play it could be the beginning of a more serious correction for this year’s bull market.
Trade wars and other turmoil seems to have taken its toll on world equity markets. In addition to this, there is political instability in the Eurozone with the Brexit situation continuously rearing its ugly head and European elections coming up with unexpected altercations.
Dow Jones Industrial Average
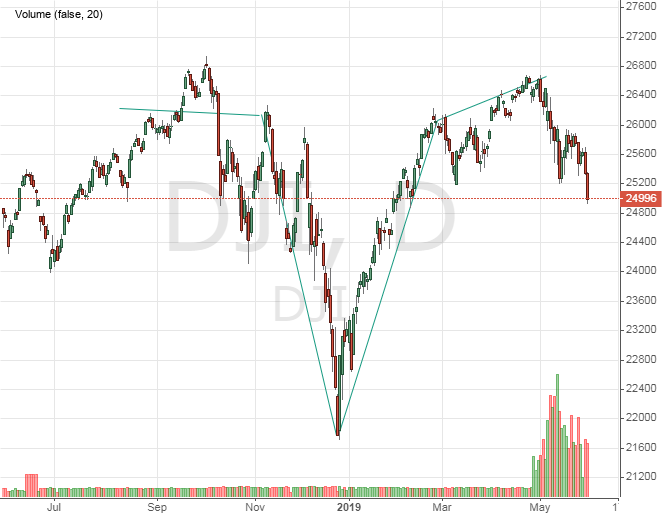
After the long holiday period markets in the US and Britain returned with extreme volatility and volume. The same technical patterns are appearing all over the world. The DOW and SnP have both stepped over the support line. Today is an important trade session. For the careful retail trader, it will be a decisive moment. If the market stays below the neckline of the head and shoulders pattern, we will most likely see a drop to support levels seen at the beginning of the year.
Even after a gap, indexes took a strong and uniform dive. Keep in mind that markets are largely computer based, algorithms run many mutual funds and bank operations. Technical breaks such as the ones we are seeing can potentially be market moving. Fundamentals are worth looking at, but the markets seem to be ignoring them and focusing on commodities, bond yields and emerging markets. All of these are showing red flags that a recession is taking place.
The head and shoulders pattern that is carved out in the Dow Jones Industrial Average is the most potent figure to trade in our opinion. This is a textbook reversal chart pattern. We discussed these patterns today in our webinar about trade strategies using patterns:
The most troubling part is that this is obvious to all traders looking at the graph, especially the big money predatory banks that gobble up little fish too eager to jump on a “break” of the neckline. The rally that we experienced in the first half of the year was strong and fast, consider it a correction to last year’s market tumble. What we could be witnessing next is a slow and steady grind to the downside.
Price has broken through 25,200 and as the patient traders that we are, we recommend waiting for a retest of this level. It is important to let the trend appear before you pick a direction in which to open the trade. The first target to take some profit off the table is 24,890 and the second, more lucrative profit target is 24,338. A stop to this trade idea is set at 25,250 keeping a fantastic risk to reward ratio of 8.3.