13 января, 2020

icorrel8 – indicator of currency rates correlation

Vladimir Ivanov
RU

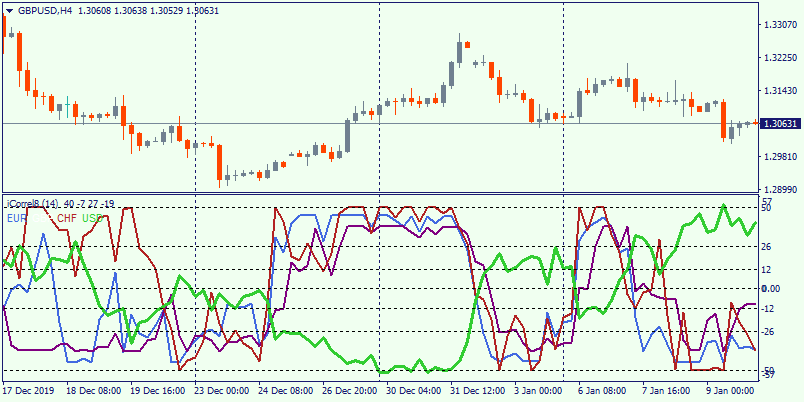
icorrel8 is an extraordinary indicator that displays correlation of FX rates on Forex. It will show dynamics of the currencies, which are included into working pair by default. However it is possible to manually attach data for other world main currencies. In the beginning we recommend to pay attention on crossing of two lines at point 0 that shows the end of the trend well. The divergence of the indicator lines indicates the strength of the current movement.

icorrel8 usage example

correl8b mod download

Подпишитесь на нас в VK

Fortrader contentUrl Suite 11, Second Floor, Sound & Vision House, Francis Rachel Str. Victoria Victoria, Mahe, Seychelles +7 10 248 2640568

Ещё из этой категории

Все статьи

The AFIRMA is a good Moving Average

You can use the AFIRMA indicator in strategies as a trend indicator or as a confirmation of the traditional Moving Average signals. It works without delay. The AFIRMA indicator is a long–developed indicator that has not lost its relevance, predicting the movements of quotations well. It looks like a moving average, but the main difference […]

HMA Color

HMA Color is improved variant of moving average that displays the direction of the current trend. Green color of forex indicator means uptrend, red – downtrend. Indicator is better when the market is in trend, because is does not displays flat. So it is good in pair with the oscillator. Also the strategy of three […]

DCE on SMMA – dynamics of moving average

DCE on SMMA or Dynamic Cycle Explorer of averages is an indicator that displays cyclical dynamics of moving average. In fact, this Forex filter is represented by trend indicator, placed in a separate field and demonstrating the direction of the current movement on the market. Obviously, it is needed to configure each separate currency pair […]

MA_3TF_VS — three moving averages

MA_3TF_VS is a comfortable variation of moving average for trading on Forex. It represents three lines, based on the data of three timeframes, which must be inputted in the settings. Crossings of the highest timeframe’s average with other MA lines and the price is the strongest signal for this indicator. The stronger the lines diverge […]

Недавние обучающие статьи

Все статьи

Редакция рекомендует

Все статьи
Loading...