03 октября, 2019

Bollinger bands for RSI — composite trend indicator

Vladimir Ivanov
RU

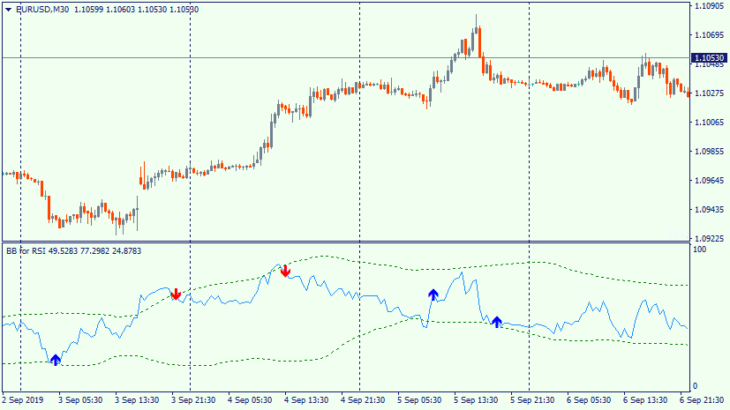
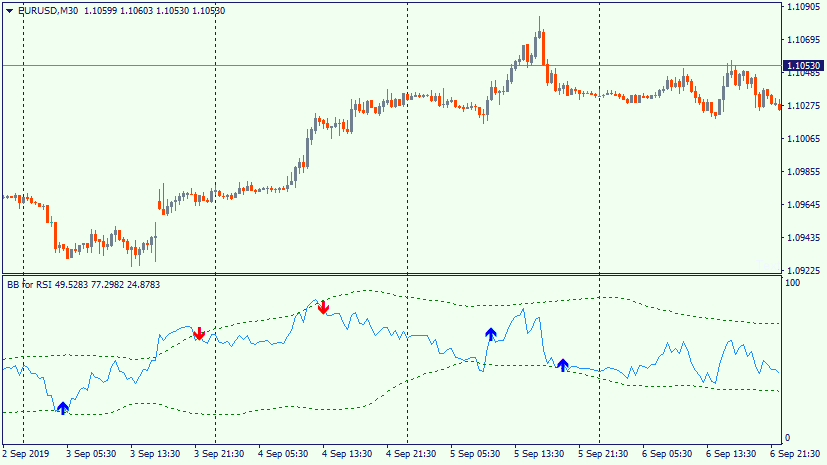
Bollinger bands for RSI is a composite indicator from two standard. Bollinger bands layered on RSI provides with interesting signals for entering the market. Oscillator must go beyond the border of the channel and return back. Signals are duplicated by arrows.

There could be redrawing during strong movements and fake signals in case of strong trends.

BBands for RSI usage example

BBands for RSI download

Vladimir Ivanov

Vladimir Ivanov

Автор

Подпишитесь на нас в VK

Fortrader contentUrl Suite 11, Second Floor, Sound & Vision House, Francis Rachel Str. Victoria Victoria, Mahe, Seychelles +7 10 248 2640568

Ещё из этой категории

Все статьи

The AFIRMA is a good Moving Average

You can use the AFIRMA indicator in strategies as a trend indicator or as a confirmation of the traditional Moving Average signals. It works without delay. The AFIRMA indicator is a long–developed indicator that has not lost its relevance, predicting the movements of quotations well. It looks like a moving average, but the main difference […]

HMA Color

HMA Color is improved variant of moving average that displays the direction of the current trend. Green color of forex indicator means uptrend, red – downtrend. Indicator is better when the market is in trend, because is does not displays flat. So it is good in pair with the oscillator. Also the strategy of three […]

DCE on SMMA – dynamics of moving average

DCE on SMMA or Dynamic Cycle Explorer of averages is an indicator that displays cyclical dynamics of moving average. In fact, this Forex filter is represented by trend indicator, placed in a separate field and demonstrating the direction of the current movement on the market. Obviously, it is needed to configure each separate currency pair […]

MA_3TF_VS — three moving averages

MA_3TF_VS is a comfortable variation of moving average for trading on Forex. It represents three lines, based on the data of three timeframes, which must be inputted in the settings. Crossings of the highest timeframe’s average with other MA lines and the price is the strongest signal for this indicator. The stronger the lines diverge […]

Недавние обучающие статьи

Все статьи

Редакция рекомендует

Все статьи
Loading...