Key Volume Zones
The First Impulse Levels (RFI) are zones of maximum volume that trigger market reversals, making them essential for future trading decisions.
The main mechanism of the price movement is that it moves from one Primary Impulse Level (RFI) to the opposite, reverse level relative to the previous trend.
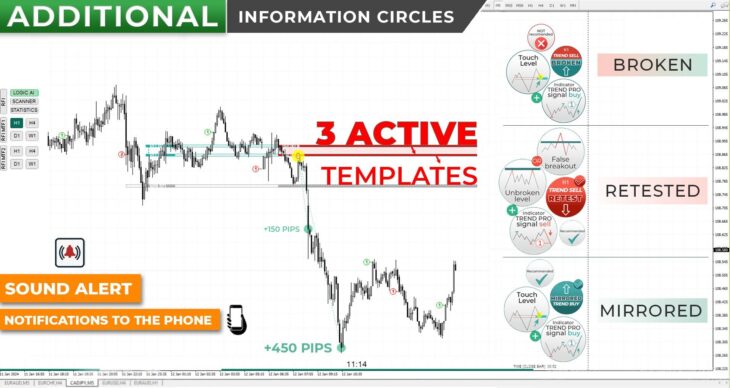
The First Impulse Level (RFI) represents a reversal zone, and the first impulse level from a previous movement is also a strong level for correction and subsequent trend development. It is recommended to look for entry points only after one of the specified patterns appears on the levels (RETEST / BROKEN / MIRRORED).
Active Pattern – This is the result of a completed price reaction (trading events) at the First Impulse Levels (RFI). After its formation, the probability of price movement in a specific direction becomes extremely high. This is a specific place or zone on the chart where the probability of price movement in a certain direction significantly increases.
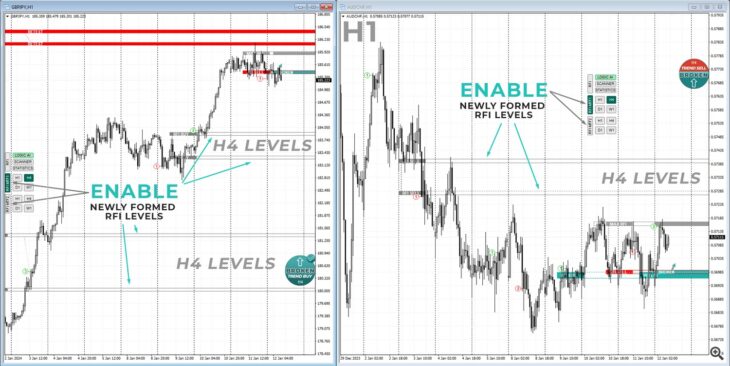
New First Impulse Levels (Without Active Patterns)
On MTF1 and MTF2, newly formed RFI are displayed as gray levels and are intended only for trade purposes. We never use the turn moment (formation of RFI) in trading, except in the case of “MIRRORED”, which is very rare. Activation is done by pressing the vertical button “RFI MTF1/RFI MTF2”.
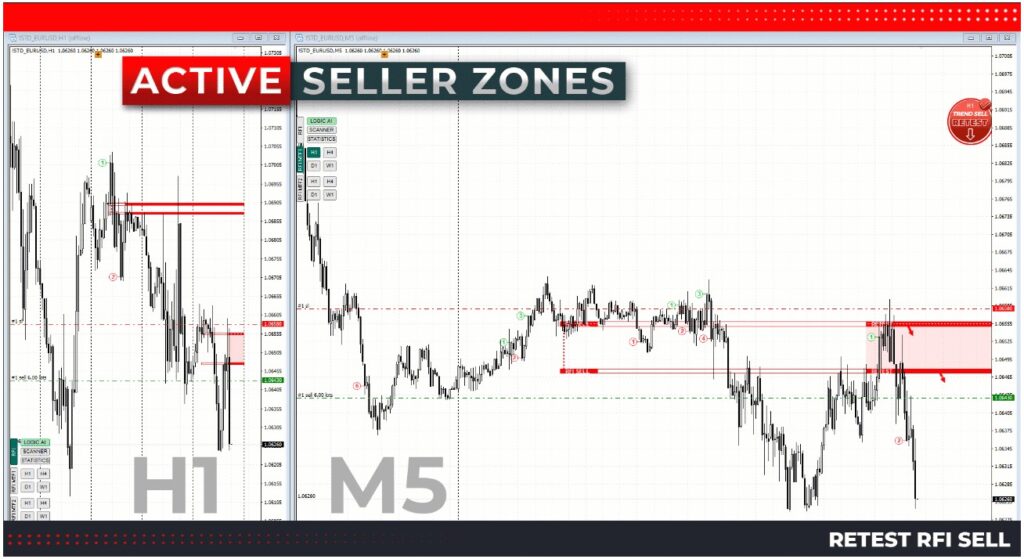
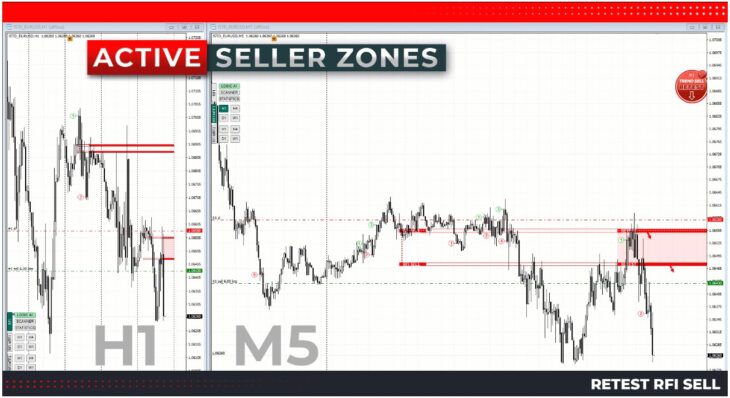
(RETEST RFI) Retest of the First Impulse Level
Price returns to the place where peak volume was recorded, which reversed the market.
When the RETEST pattern is activated, an alert and phone notification are triggered. RFI levels from the H1 timeframe are used for trading. Additional conditions are checked on the M5 timeframe. The activation of the pattern/retest is automatically determined by the indicator.
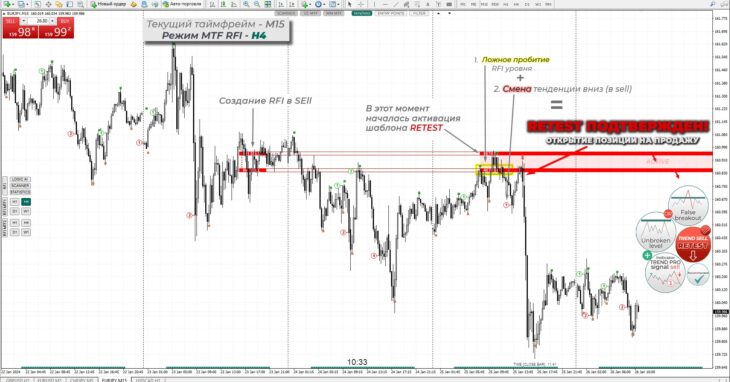
After activating the RETEST pattern, the following conditions are required on the M5 timeframe:
- Fake breakout (FB) or no breakout (NB) of the RFI level
- Trend change on the current timeframe.
(BROKEN RFI). Break of the First Impulse Level
Canceling a false reversal and continuing the movement with the current trend. A yellow circle appears on the RFI level touch or its MAX/MIN. This is the place from which we look for additional conditions for the entry point.
RFI levels from the H1 timeframe are used for trading. Additional conditions are checked on the M5 timeframe.
The activation of the pattern/broken is automatically determined by the indicator!
After activating the BROKEN pattern, the following conditions are required on the M5 timeframe:
- Touching the RFI (H1) level or the RFI MAX (H1) level (yellow circle)
- The trend on the M5 timeframe should match the direction of the pattern. If not, wait for a new trend change. (Indicator TPSproTREND PRO)
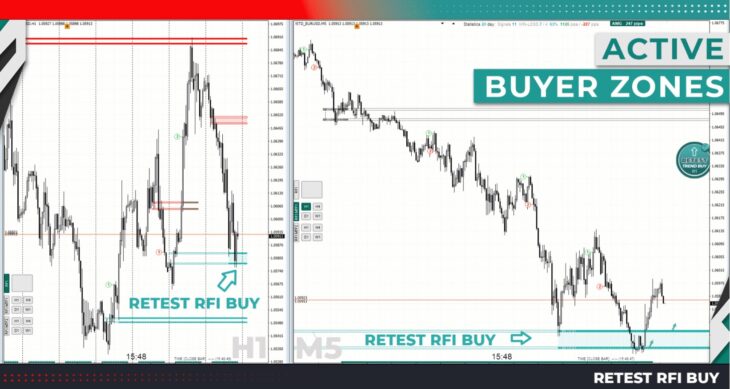
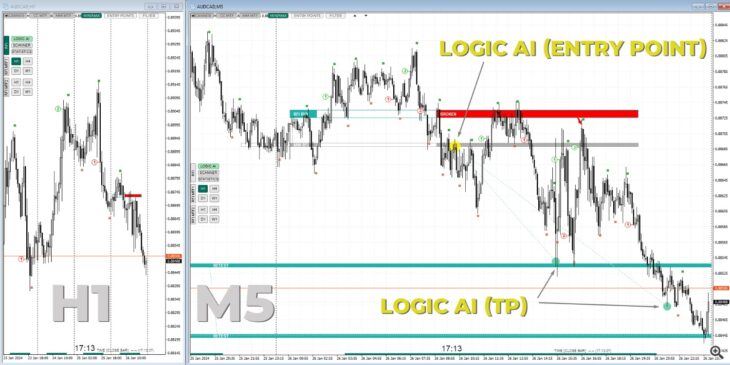
LOGIC AI
For the BROKEN pattern, a separate logic has been added, which after activation shows places for finding entry points, minimum levels for TP1 / TP2, and determines the template cancellation point, after which it cannot be used for trading. A separate button is available on the panel for activating this logic – LOGIC AI
- Yellow circle – place for finding the entry point (touching the level ±20 pips).
- Green circle No1 – first minimum take profit ≈ 150 pips.
- Green circle No2 – second take profit (2 logics).
- Red circle – the pattern (situation) that has been worked out in the negative.
- Gray circle – cancellation of the pattern.
Important! When the BROKEN pattern is active, there should be no FB of the RFI MIN/MAX level. If you already have an open position, minimize risks. It is recommended to trade the BROKEN pattern only in the direction of the trend. It is recommended to trade the BROKEN pattern only up to two corrections of the higher trend.
Download the demo version of the indicator or buy it
FAQ
What are RFI Levels?
RFI Levels are key volume zones that trigger market reversals, making them essential for future trading decisions.
How do I use the RETEST pattern?
The RETEST pattern is activated when the price returns to the place where peak volume was recorded, which reversed the market. It requires specific conditions on the M5 timeframe.
What is the BROKEN pattern?
The BROKEN pattern indicates the cancellation of a false reversal and continuation of the movement with the current trend. It is automatically detected by the indicator and requires specific conditions on the M5 timeframe.