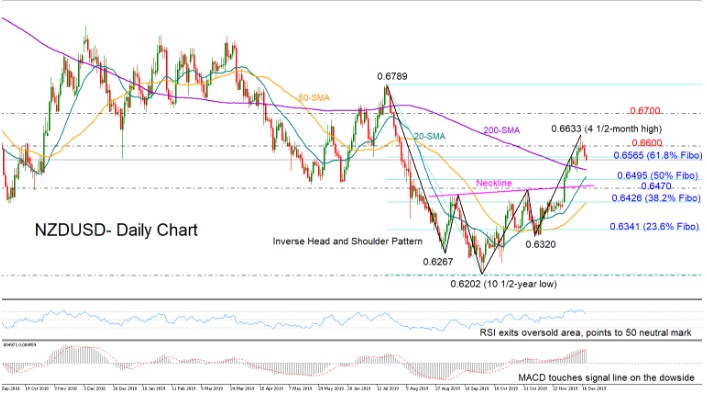
NZDUSD flipped back into the 0.6500 region after failing to hold above the 0.6600 bar. The price is currently testing the 0.6565 level, which is the 61.8% Fibonacci of the downleg from 0.6789 to 0.6202, with the RSI and the MACD suggesting that some weakness may persist as the indicators seem to be losing momentum in the positive territory.

The uptrend off the 10 ½-year low of 0.6202, however, remains intact and only a closing price below the neckline of the inverse head and shoulder pattern seen around 0.6470, would question the sustainability of the upward direction. Before that the 0.6525-0.6496 region encapsulated by the 200-day simple moving average (SMA) and the 50% Fibonacci could deter such an action. If not and the sellers take control under 0.6470, piercing the 38.2% Fibonacci of 0.6426 too, then the way would open towards the 23.6% Fibonacci of 0.6341.
In the positive scenario, a rebound at 0.6565 would aim for the 0.6600 level. If efforts prove successful this time, with the price climbing above the 4 ½-month high of 0.6633 reached on Friday, resistance may then shift up to 0.6700.
A potential bullish cross between the 20- and the 200-day SMAs would be an encouraging signal for the market direction.
Summarizing, although NZDUSD may face some pressure in the short-term, the positive trajectory in the medium-term picture is likely to hold in place – unless the market deteriorates below 0.6470.