
Candlestick analysis of the currency market and other financial sectors has remained popular for over 200 years. Invented by the Japanese, it continues to prove its effectiveness today and is in demand among traders. Candlestick patterns consist of combinations of 1-5 market bars, which, when analyzed, allow forecasts of further market movements.

n
Candlestick analysis is successfully applied to various assets: stocks, cryptocurrencies, metals, derivatives. The reason is the similar behavior of speculators, despite different factors affecting the instruments and their volatility. Candlestick patterns reflect emotions and trend phases, which differ perhaps only in the speed of their occurrence.
n
Contents
- nt
- How to Trade Using Candlestick Analysis?
- Candlestick Analysis in Practice Right Now
- Uncertainty Candle on Forex
nt
nt
- nt
-
- nt
- Doji (doji)
- nt
How to Trade Using Candlestick Analysis?
To trade using patterns on Forex (also known as candlestick analysis), you only need a stream of quotes for the selected instrument. The bars and their formations serve as market indicators. This is especially convenient on higher timeframes for long-term trading, when you only need to check the terminal once a day.
Using candlestick analysis in trading is quite simple – you need to know the pattern itself and the consequences of its appearance – trend continuation or reversal. Open a trade after the close of the last candle of the pattern to avoid false signals.
nn
Stop order levels for each candlestick pattern are placed according to specific rules; however, typically for reversal patterns, it is the low point of the pattern, and for trend continuation figures, it is the high point.
n
This article presents a list of interesting, mostly non-traditional candlestick patterns with brief trading recommendations. If you want to use them, we recommend delving deeper into the workings and economic meaning of each individual pattern.
nDescription and application of traditional technical analysis models can be found here.
Candlestick Analysis in Practice Right Now
There are many different candlestick analysis patterns in the world – modern and quite ancient ones observed during the formation of financial markets. We have selected the main patterns you may encounter on the market. There are quite a few – 31 in total, so the article is divided into several parts.
n
One list of candlestick patterns will complement another, so you can start studying and applying them today with this article. You can then deepen your candlestick analysis knowledge with each new publication.
n
For convenience, we have divided the patterns into trend continuation models, where you enter the market in the direction of the overall movement, and reversal models, where you orient toward the start of a correction or trend change.
n
In the article, bullish candles are denoted by green colors, bearish by red.
Uncertainty Candle on Forex
This candlestick pattern is unique in theory. For analysis and forecasting price movement, only one bar is needed.
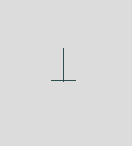
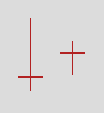
1. Doji (doji)
 n
n
We start with the Doji candle, as the most unusual market situation. This is a candle where the open price equals the close price. The size of the shadows can vary. As a result, the candle resembles a cross, an inverted cross, or a plus sign.
n
The appearance of a Doji in candlestick analysis indicates uncertainty in the market. Bulls and bears are like playing tug-of-war.
nMore about Doji: «Doji»: complex qualities of a simple graphical model
Reversal Patterns in Candlestick Analysis
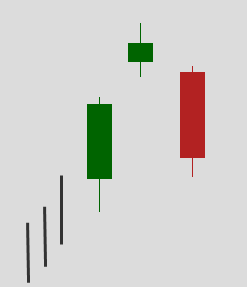
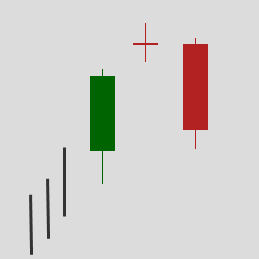
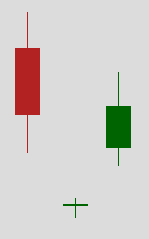
2. Abandoned Baby (abandoned baby)
 n
n
A rarely occurring reversal candlestick analysis pattern where a Doji candle is surrounded by two gaps in opposite directions. The Doji shadows must be below/above the shadows of neighboring candles.
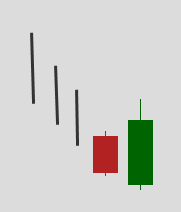
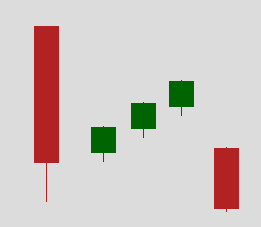
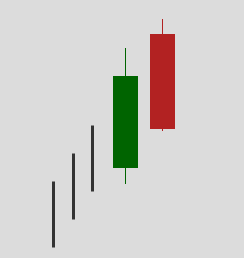
3. Dark Cloud Cover (dark cloud cover)
 n
n
A bearish reversal candlestick pattern. The first candle is bullish with a large body, the second is bearish with an open price above the maximum of the previous candle and a close price below the midline of the previous candle’s body.
n
This pattern often appears at the end of sharp, fast movements on news, when all the positivity has been played out.
4. Dragonfly Doji (dragonfly doji)
 n
n
A Doji candle with a long lower shadow and no upper shadow. This Forex pattern is one of the trend reversal signals. Bulls no longer have the strength to break through the open level and continue growth. The signal strengthens if a large bullish candle preceded the Doji.