What Is Divergence on Forex?
Today, there are several divergence indicators, but even using such analyzers will not give you effective trading results if you don’t have at least a general understanding of what forex divergence is. In general, the meaning of both divergence and convergence lies in the oscillator’s deviation from the price chart. Usually, the following indicators are used for analyzing divergence on forex: MACD, slow Stochastic, OsMA, RSI, CCI, and similar.
There are different opinions around using divergence on forex indicators like ‘oscillator’. Some traders see divergence as a nearly 100% signal to enter the market. Others, on the contrary, consider divergence on oscillators completely useless. In reality, there is some truth in both statements.
We will try to cover most of the methods of using so-called divergences, using forex oscillators with divergence, and possibly the most important question – the importance of indicator settings and the timeframe of currency instruments used in trading. Because this is actually the scary moment for many traders, the indicator you use to determine divergence can show completely different signals with various settings. What to say about the time frame you choose. So let’s start by looking at the classification of methods used in trading divergence on forex.
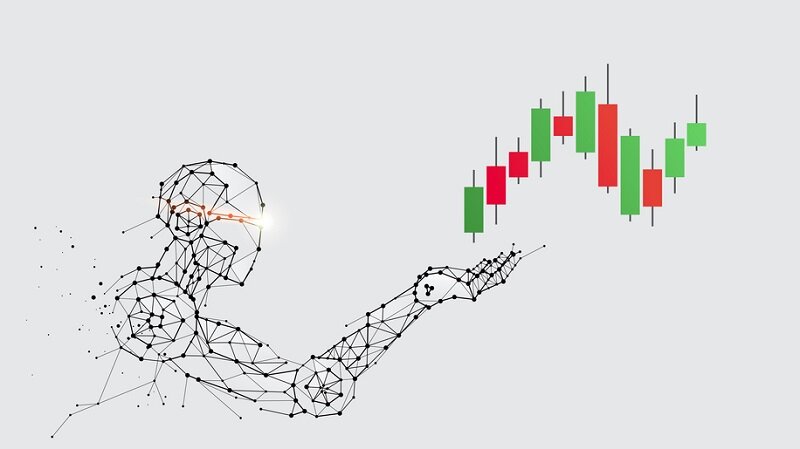
 Example of Divergence
What Does Divergence on a Chart Indicate?
The presence of divergence on a chart indicates a possible price reversal. This mismatch is often called bullish or bearish, depending on where the price moves after the reversal: bullish divergence reflects an increase, while bearish divergence reflects a decrease.
Types of Divergence
In stock trading, several types of divergence are distinguished:
Class A Divergence
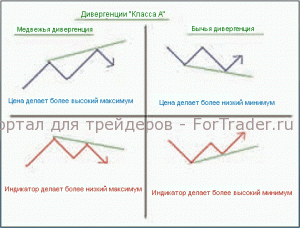 Class A Divergence
- Class A: Bearish Divergence – a new high on the price chart is higher than the previous high, while a new high on the oscillator chart is lower than the previous high.
- Class A: Bullish Divergence – a new low on the price chart is lower than the previous low, while a new low on the oscillator chart is higher than the previous low.
As you can see, there is nothing complicated in identifying the main and strongest Class A divergence. Everything is very simple and clear. The logic of application is quite understandable and should be effective, because any indicator is a more smoothed representation of currency fluctuations based on the history of movements of the currency instrument before this moment. Basically, divergence simply helps identify what is difficult for the human eye to notice, and to enter the market, taking the upcoming movement as much as possible.
Class B Divergence
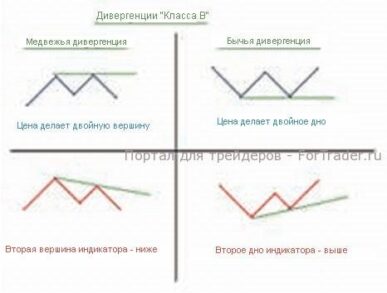 Class B Divergence
- Class B: Bearish Divergence – price chart highs are at the same level, forming a double top, while the second peak on the oscillator chart is at a lower level than its predecessor.
- Class B: Bullish Divergence – price chart lows are at the same level (double bottom), and the second low is higher than the previous one.
This type of divergence is considered slightly weaker than Class A divergence, but it should not be ignored. Because it often determines the start of a good trend. As you have already noticed, any divergence is a signal for a bounce (trend reversal), unlike convergence, which signals its continuation. Let’s now look at the final type of divergence – Class C divergence.
Class C Divergence
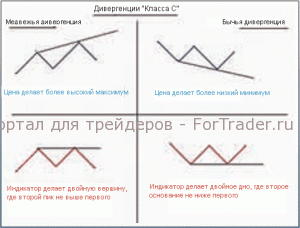 Class C Divergence
- Class C: Bearish Divergence – on the price chart, there is a higher high than the previous one, while the peaks on the oscillator chart are at the same level.
- Class C: Bullish Divergence – on the price chart, there is a lower low than the previous one, while the oscillator chart shows a double bottom.
There is also a special type of divergence – triple divergence. This is the rarest and almost error-free forex signal. It consists of three swings (either highs or lows) on both the price chart and the oscillator. An interesting feature is that the initial divergence signal ‘fails’.
How to Identify Divergence?
Usually, divergence is identified visually on the chart. For the convenience of traders, a number of technical divergence indicators have been specifically developed, significantly simplifying the identification of divergences and trading them.
Settings of Oscillators and Timeframe
Here, no one can tell you the correct answer. Trading on divergence on forex, even though it is close to some fundamental data – is a delicate following of the price and its formations, still remains a probability method.
Of course, it points you to some ‘price catastrophes’ that you can use in your trading, but it cannot explain why the price should change direction.
FAQ
What is divergence in forex trading?
Divergence in forex trading refers to a discrepancy between the price movement and an oscillator’s readings, indicating a potential trend reversal.
What are the types of divergence?
The main types are Class A, Class B, and Class C divergence, with Class A being the most significant for trend reversal signals.
How is divergence identified?
Divergence is typically identified visually on a chart, though some traders use technical indicators to simplify the process.