


The market is a collection of views, ideas, and opinions from all its participants. It’s important to remember that using trading methods based on market sentiment does not always provide completely accurate entry and exit points for every trade. However, combining market sentiment analysis with other technical and fundamental methods can significantly improve your trading performance.
In introduction, I want to present a general economic law. The example of the relationship where the price of any market asset is built based on the balance of supply and demand in the market. Therefore, when demand increases, the price of the asset will be higher. The more supply, meaning the more sellers in the market, the lower the price of the asset.

Other articles from the Masterclass “Financial Debates”
- Forex: Human vs. Robot
- Metatrader 4 vs. Metatrader 5
- European Debt vs. US Government Debt
- Large Leverage vs. Small Leverage
- EUR/USD vs. USD/RUR
Fundamental Market Tools
It is no secret that you can find a large amount of analytics on the internet for the forex market: forecasts, economic calendars, market news, and so on. How can you use this information? Obviously, just following it is not advisable. A lot of people review the analytics, and by analyzing several forecasts from different sources, you can predict how the crowd thinks. If we talk about specific tools, we can take the fresh forecast (see fig. 1) as an example.

It presents several types of analytics for the most popular currency pairs, and it is visible that some of them predict growth, while others predict a decline. From such information, you can make the necessary selection and use it as a market sentiment tool.
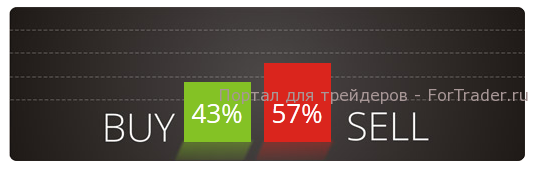
The percentage of traders who have opened buy or sell trades changes depending on the market situation. When there is a very large bias, for example, 70-80%, it is recommended to join the minority.
Technical Tools of the Market
There are a huge number of them. For example, let’s take an indicator based on volatility and an indicator that shows market sentiment based on volume. We will not discuss the details of working with them now.
A popular indicator that well shows overbought/oversold conditions is the RSI (Relative Strength Index). It uses levels of 30 and 70 by default, but it is also recommended to add 50, which will show who dominates the market. If the RSI chart is above the 50 line, then the bulls dominate; if below 50, the bears do.
Similar to this principle work other indicators, such as Stochastic, Momentum, ATR.
COT Reports
COT reports should be used as a component of comprehensive analysis, although some traders take them as the basis for their trading. From the perspective of understanding market sentiment, they are what you need, since they are a very objective tool. This is a tool for medium-term trading, i.e., for timeframes above one hour. COT reports are based on derivative financial instruments – futures and options. They are published every Friday by the Commodity Futures Trading Commission (CFTC). According to American laws, all transactions on futures and options markets in the US must be registered and regulated by the regulator, which is the CFTC. The COT reports contain information about long and short positions of both institutional, large, and small speculators, and they are an excellent source of information for us to assess how strong the positions of certain market participants are. The main advantage of these reports is that we see not the overall picture, as some indicators in Metatrader show, but the division into groups of participants: hedgers, large, and small speculators.
In the reports, we are interested in the net position – the total position, that is, if the total position size is 100 contracts, it is the difference between the volumes of bought and sold. The reports are available in the public domain on the cftc.gov website.
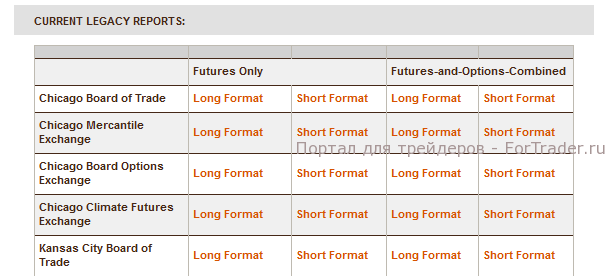
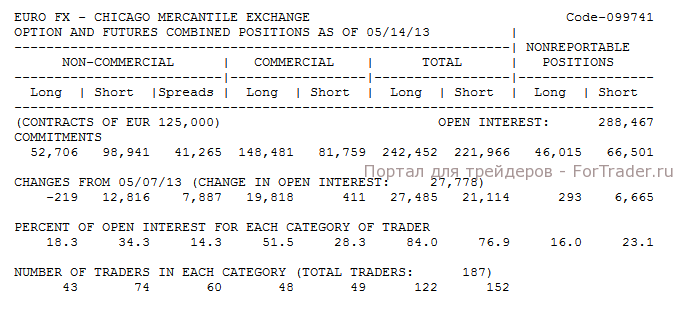 Fig. 4.
FAQ
What is market sentiment in trading?
Market sentiment refers to the overall attitude of traders and investors towards a particular asset or market, influencing price movements based on supply and demand.
How can COT reports help in trading?
COT reports provide insights into the positions of different market participants, such as institutional and retail traders, helping assess market strength and potential trends.
What role does RSI play in market analysis?
The RSI (Relative Strength Index) helps identify overbought or oversold conditions in the market, indicating whether bulls or bears are dominating price action.


