06 июня, 2019

EURGBP bulls look exhausted near 5-month high

XM team
RU

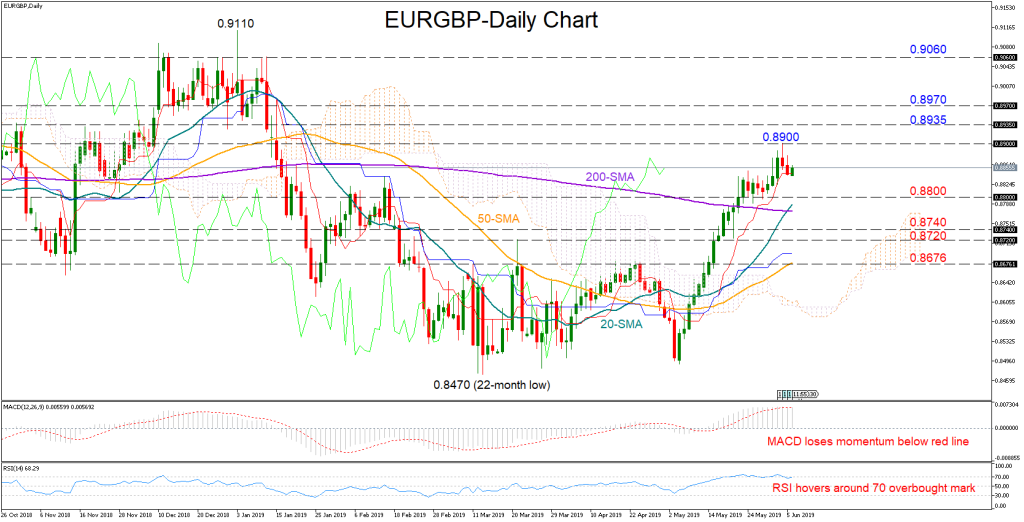
EURGBP stretched its four-week rally to an almost five-month high of 0.8900 on Tuesday before pulling slightly lower.

EURGBP
EURGBP, Daily chart

The MACD seems to be losing momentum below its red signal line, the RSI is still hovering around its 70 overbought mark and the red Tenkan-sen is flattening well above the blue Kijun-sen, all signaling a more cautious trading in the short term.

The market trend, however, is likely to hold on the upside as long as the price holds far above its moving averages and the Ichimoku cloud.

Should weakness extend below the 0.8800 mark, support to downside movements could be initially detected within the 0.8740-0.8720 area. Clearing that zone, the next stop could be around 0.8776, a frequently tested level since the start of the year.

Alternatively, the pair needs to overcome the 0.8900 top to meet a key barrier between 0.8935-0.8970. The 0.9000 mark could act as resistance too before a more important battle starts near 0.9060

In the three-month picture, the sentiment turned bullish after the price surpassed the 0.8676 number. The positive slope in the 50-day SMA, which moves closer to the 200-day SMA, also adds optimism for a brighter outlook.

All in all, EURGBP maintains bullish both in the short and the medium-term timeframes.

Подпишитесь на нас в VK

Fortrader contentUrl Suite 11, Second Floor, Sound & Vision House, Francis Rachel Str. Victoria Victoria, Mahe, Seychelles +7 10 248 2640568

Ещё из этой категории

Все статьи

How long to the parity for EURUSD?

EURUSD price is continuing to decrease. The last time we discussed the parity was in May 2017, now EUSUSD price is very close to it. Euro started the decline in Apr’18 and still in the downside trend, which could be lasted at least to 1.06. Further movement will depend on persistence of the Bears and […]

Brent oil price to drop down to $50

Brent oil price has been continuing active decrease since the beginning of 2020 and lost almost 20% or more than $17. It was mainly caused by difficulties in OPEC+ agreement fulfillment, presence of shale companies, new fields and partly by political and medical conditions in the world. Technically, brent oil price has overcome the main […]

Local appreciation of the ruble to 63.5 is possible

USDRUB returned to growth after sharp drop at the beginning of 2020. Price has already recovered over 50% of decrease and according to MACD it is not the end of upside movement, but only the beginning. After a short pause a new upward surge to the level of 63.5 rubles per dollar is possible.

Will gold price move to $1520 under correction or not?

Will gold price move up or breakdown the support line at $1550 as a correction to the recent strong growth? Analysts and market experts still find it difficult to give a definite answer. Technically, it wants to correct to $1520, but fundamentally market needs protective assets. So we recommend to wait.

Недавние обучающие статьи

Все статьи

Редакция рекомендует

Все статьи
Loading...