


This is a new strategy on our site. It is very interesting because it works on two time frames — H4 and Daily. You can choose which one to use, or use both — the rules are the same.
Settings
Buy Signals
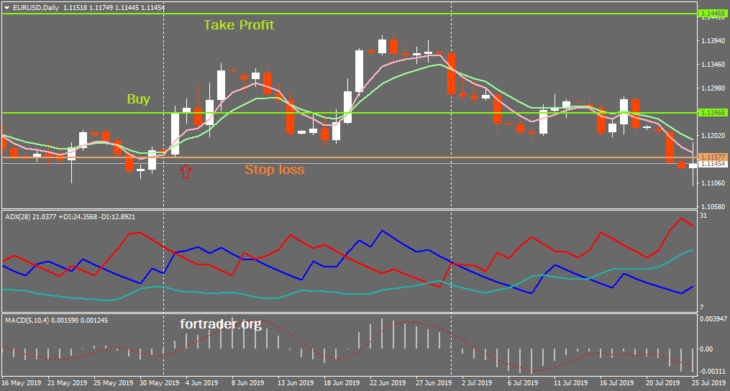
- ЕМА(5) crossed ЕМА(10) bottom-up.
- At the same candlestick blue line D+ of ADX indicator is higher than red line D-.
- MACD is above the zero level.
- At the opening of the next candlestick – buy.
Sell Signals
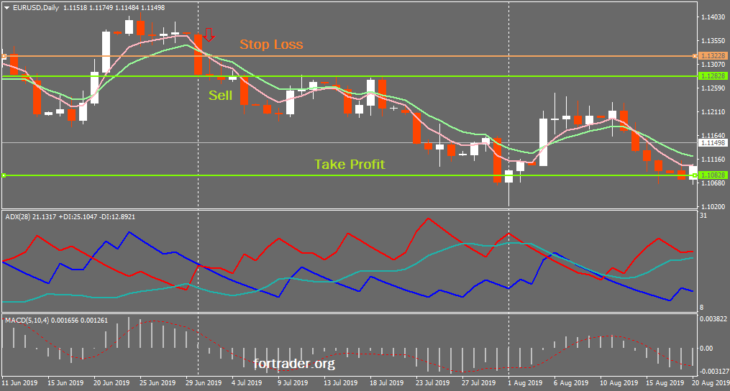
- ЕМА(5) crossed ЕМА(10) top down.
- At the same candlestick blue line D+ of ADX indicator is lower than red line D-.
- MACD is below the zero level.
- At the opening of the next candlestick – sell.
Monitoring of a deal
Daily chart
- Stop loss placed on the min price (for purchase deals) / max price (for sell deals) of the signal candlestick.
- Take profit is 250 points for GBP/USD and 200 points for EUR/USD.
- The transaction is transferred to breakeven if profit reaches half size of the take profit.
Н4 chart
- Take profit is 70 points for GBP/USD and 60 points for EUR/USD.
- Stop loss placed on 3-5 points lower (for purchase deals) / higher (for sell deals) of ЕМА(10) at the signals candlestick. Stop loss cannot be less than 35 points and more than the take profit size.
- The transaction is transferred to breakeven if profit reaches +40 points.