


Gold prices are falling on July 1st, but it doesn’t seem as a proper trend reverse. The precious metal has grown pretty much recently due to increased interest of investors in “safe haven” assets. After investors got more or less positive news from the G20 summit, they are starting to relax to adjust their investment portfolios.
This refers to the announcement from the American and Chinese leaders, who reached agreement at the G20 summit in Japan to resume negotiations. The White House made some concessions to Beijing, such as allowing US companies to continue selling to the Chinese company Huawei. The resumption of talks was seen as positive for market players – the USD started recovering, while Gold started a correction.
However, it’s hardly the end of this trade drama. No one can be sure that this trade truce may be a real foundation for conclusion of the trade agreement, because it is rather complicated and has many controversial points. On top of that, everybody knows perfectly well that the USA are very unstable when it comes to the trade agreement. The things that are looking excellent today may turn upside down tomorrow. And when it happens, demand for Gold will return.
Graph XAUUSD
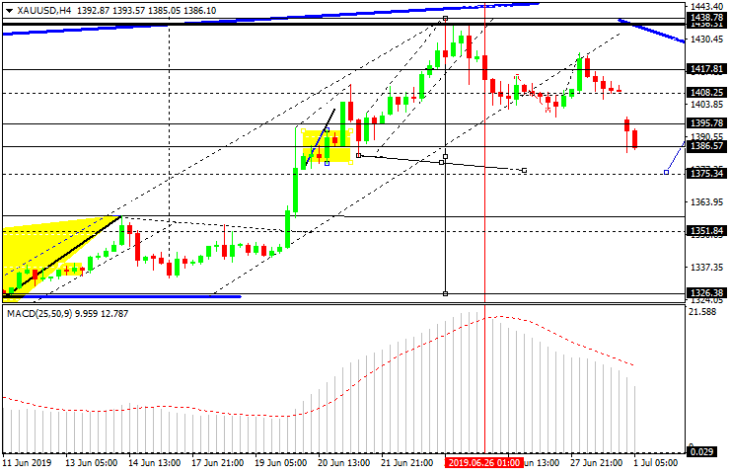
As we can see in the H4 chart, XAUUSD is forming the first descending wave with the target at 1375.35. After that, the instrument may start a new correctional structure towards 1408.25 and then form the third descending wave to reach 1350.00. From the technical point of view, this scenario is confirmed by MACD Oscillator, as its signal line is moving downwards to reach 0. After breaking it, the instrument may quicken its decline.
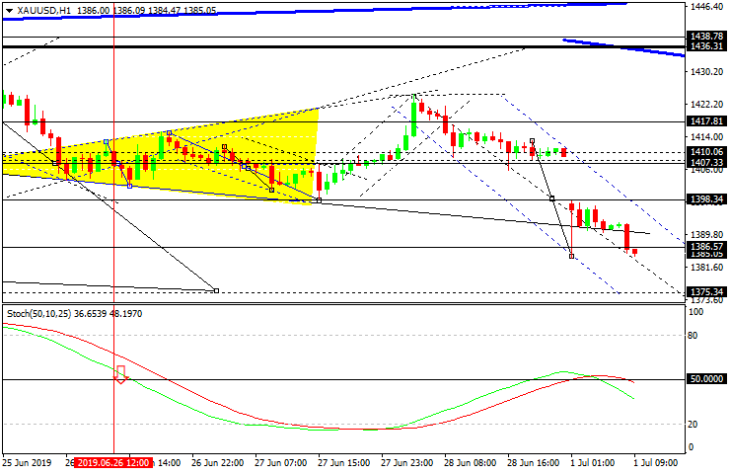
In the H1 chart, XAUUSD is trading downwards with the target at 1375.35. Later, the market may form a new consolidation range near the lows. If the price breaks the range to the upside, the instrument may start a new correction to reach 1407.33 (at least) and ten continue trading inside the downtrend with the short-term target at 1350.00. From the technical point of view, this scenario is confirmed by Stochastic Oscillator, as its signal line has broken 50 upwards again. The current downtrend may continue until the signal line starts reversing and moving away from the “oversold area”.