


Gold is falling at the end of September. On Monday, September 30th, the Troy ounce of this precious metal is trading at 1,499 USD. Investors have been selling the instrument for the fifth trading session in a row.
On one hand, Gold prices got under significant pressure from the USA, which has seriously strengthened recently. Market players have been discussing the bleak outlook of the European economy, thus making risky assets less attractive.
On the other hand, the impeachment of the US President Donald Trump prevented Gold from plunging deeper. Rumors on the investigation are a good catalyst for market fluctuations, which can be easily seen in movements of major instruments.
At the same time, investors do intend to buy Gold when its price goes down. In addition to that, in the short-term Gold may be supported by the news about capital restrictions: earlier, the White House said that it was discussing how to restrict portfolio flows from the USA to the Chinese economy.
Technical charts of Gold
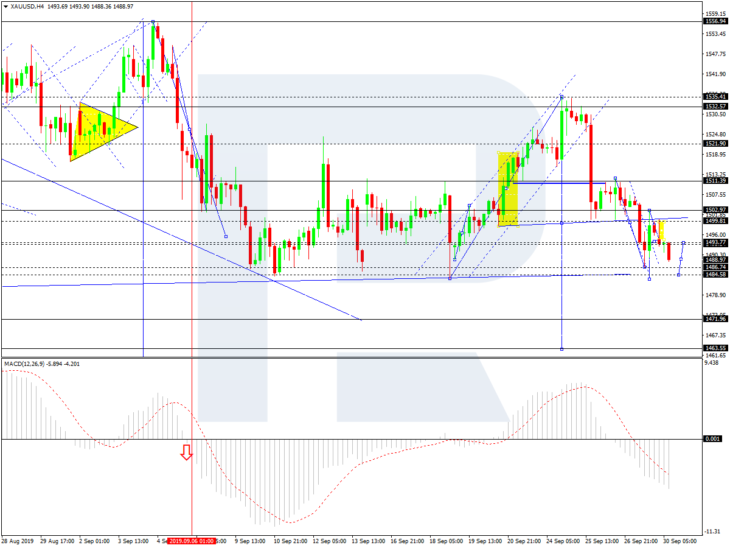
In the H4 chart, XAU/USD is forming another descending structure with the target at 1463.60. Today, the pair may reach 1484.60 and then start a new correction towards 1493.77. After that, the instrument may resume trading downwards to reach 1472.00. From the technical point of view, this scenario is confirmed by MACD Oscillator: its signal line is moving below 0, thus confirming further downtrend.

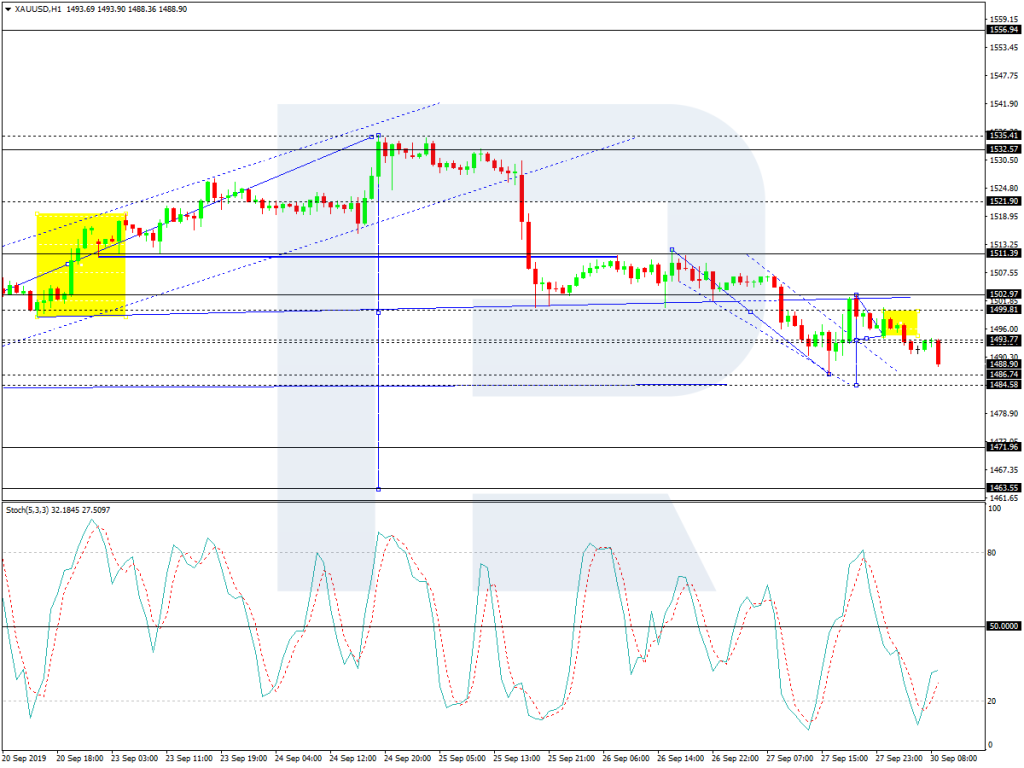
As we can see in the H1 chart, XAU/USD is trading to rebound from 1502.95 to the downside. This structure may be considered as the fifth wave inside the downtrend with the target at 1463.60. Possibly, today the pair may form a new descending structure to reach 1484.60 and then start another correction towards 1493.77. Later, the market may resume trading downwards. From the technical point of view, this scenario is confirmed by Stochastic Oscillator: its signal line is moving inside the “oversold area”. After reaching the target level, the indicator is expected to break the area to the upside, thus confirming a new correction. Later, the downtrend may resume.